Calculated columns are one of the most useful features in SharePoint. They have a few more limitations than Excel formulas, but with a little massaging, they can do a lot of heavy lifting.
As an example, I created a commission and forecasting tool for a fictional business.
To see an excellent list of all SharePoint Formulas visit this link.
 Calculating Commissions
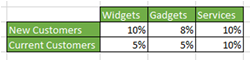
In this scenario, a salesperson has a tiered compensation plan in which different products sold to current and new clients are compensated in different amounts. The client needed compensation automatically figured for each sale.
- New customer orders buying widgets or services are compensated at 10% of the revenue
- New customer orders buying gadgets are compensated at 8% of the revenue
- Current customers are compensated at 5% of the revenue for widgets and gadgets and 10% on Services
The sales forecast is kept in a SharePoint custom list. The client needs to be able to pull up a report for each rep’s commissions each month.
Solution
I started with a sample forecast uploaded into a custom SharePoint list. Some of the columns like “Total Revenue” and “Compensation” imported as numbers. I need those fields to be calculated, so I had to recreate them in SharePoint.
After the data was ready, I created a filtered view that shows deals and totals for products shipped last month. This sounds easy, but it actually presents a little problem: The ship date reads in this format: MM/DD/YYYY. How do you filter that data automatically by month?
My solution was to create another calculated column that reformatted the date, and then, filter on that column.
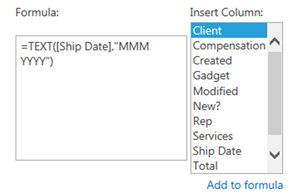 Under “List Settings” choose “Create Column”. Then name the column “Month”, choose “Calculated” for the type, and use the following formula:
=TEXT([Ship Date], “MMM YYYY”)
Now, for example, the date “05/21/2014” Reads “May 2014”.
Creating a view
Now that I know when the product shipped, I need to build a view that only shows the deals for a specific rep from last month. First, I filtered for items with May 2014 for Month. I grouped by Rep, and I totaled all of the figure columns.
This method had a few limitations. First, each month I’ll need to manually update the view to filter based on the correct month. There isn’t a way to adjust the view based on the current date without code.
SharePoint also does not allow for totaling calculated columns, so the total column and the commission column won’t total without using SharePoint Designer.
Figuring Commissions
The commission field was tricky. Reps are compensated at a different rate for new clients than they are for current clients, and new clients pay differently depending on the type of product or service sold.
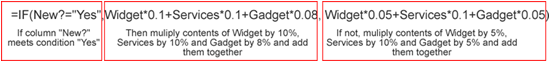
I built an IF statement to calculate the commissions for new sales first.
=IF(New?=”Yes”,Widget*0.1+Services*0.1+Gadget*0.08)
Then I added an IF NOT clause for the Current customers.
=IF(New?=”Yes”,Widget*0.1+Services*0.1+Gadget*0.08, Widget*0.05+Services*0.1+Gadget*0.05)
That calculated commissions for all of the shipped deals.

