SharePoint Business Intelligence (BI) can be expensive to deploy since it requires SP Enterprise and SQL Enterprise or BI. Power BI for Office 365 is another option, but that cost can stack up too.
If the goal of your BI project is simply to create a simple dashboard, then within certain limitations, even a SharePoint Foundations site can manage that project. The ingredients are Excel, PowerPoint, SharePoint (any edition), and SQL if desired. Follow this recipe for a BI dashboard without the cost.
Create your dashboard
Business Intelligence dashboards are single “panes of glass” displaying data from several sources. Financial BI dashboards, for example, might have information from the accounting system, sales forecasting system, and ERP.
Whatever the data’s origin, we’ll need to bring it into Excel first to create the dashboard.
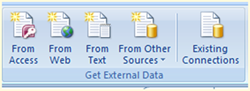 Open a blank Excel spreadsheet. Under the Data tab, choose the appropriate option in the Get External Data group. Follow the prompts to select your data and bring it into Excel.
Build the tables and charts the way you want them to appear in your SharePoint BI Dashboard. When you’re satisfied, save your spreadsheet in OneDrive or SharePoint.
You’ll be linking to this document through PowerPoint in SharePoint, so be sure that it is in a place that it will be constantly accessible.
Linking an Excel chart in PowerPoint
Next, open a new PowerPoint presentation and save it into OneDrive or SharePoint. Then, create a blank slide to house your dashboards. Under the Insert tab, choose Object. Select the radial button “Create from file” since we already have the Excel document. Make sure to check the link box so that the PowerPoint presentation will update the data each time it’s opened, and click ok.

Your Excel spreadsheet will appear on the slide. Add whatever graphics or diagrams on the PowerPoint that you would like, but do not change the data.
You’ll be able to house several dashboards in the same PowerPoint presentation by creating separate slides for each dashboard. Once on the SharePoint site, users will be able to scroll through the dashboards by scrolling through the slides.
Embed PowerPoint in SharePoint
Once you’re satisfied with the dashboards, you’ll need to embed them in a SharePoint site so that everyone can see them. First, save your PowerPoint presentation into SharePoint or OneDrive. Then find your presentation through the web interface.
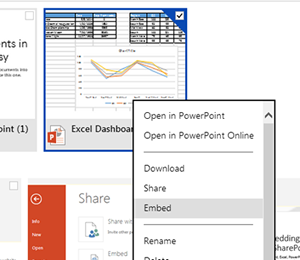
For OneDrive, open up the web interface and find your PowerPoint presentation. Right click on the presentation and choose Embed. On the next screen choose Generate so that you can copy the HTML code.
In SharePoint, click on the … next to the presentation. Then, click on the menu beneath the preview to find the Embed command.
The code will look something like this:

Adjust the width and height by increasing or decreasing the “402” and “327”. These numbers represent width and height in pixels.
 Put your presentation in SharePoint

Open the SharePoint page that will house your Business Intelligence dashboard in edit mode. Under the Insert tab choose “Embed Code” and paste your PowerPoint Embedding code. Save your changes, and your dashboard will appear.
To update your dashboard, you’ll need to open, update, save, and close the PowerPoint presentation. This refreshes the data connections to Excel and the database. Any other changes on the PowerPoint presentation will be live on the site immediately.
